> ## Documentation Index
> Fetch the complete documentation index at: https://docs.frankieone.com/llms.txt
> Use this file to discover all available pages before exploring further.
# UBO Visual Ownership Tree
> Show individual percentage ownership of investment represented in a tree structure
## Introduction
The term UBO stands for Ultimate Beneficial Owner, which refers to the natural person who ultimately owns or controls a legal entity. Banks and corporations are required by law to identify and verify the UBOs of their customers and partners, as part of their Anti-Money Laundering and Anti-Terrorist Financing obligations. This helps to prevent financial crimes and ensure transparency in the business sector.
To identify the UBO, we:
* Acquire the organizations credentials
* Research ownership chain
* Single out the ultimate beneficial owner
The objective of the Visual Ownership Tree is to represent the actual share owners in a diagrammatic tree format. We dig deep into the share holding structure to know the individual who actually owns what percentage of Investment. The same information is represented in a PDF as tree structure in the generated report.
Additionally, you can view the directors of the companies that are represented in the Visual Tree Diagram of UBO report.
When there are corporate shareholders jointly holding shares, the visual tree will not traverse any further. We recommend further investigation in other areas of the report.
## Viewing the UBO Visual Tree
You can view the UBO Visual Tree from the generated UBO Report.
To view the last UBO report generated:
1. Select the **Monitoring** tab from the Dashboard.
2. From the **Overview** page, go to the **Completed Checks** section.
3. Select the **View Report** button to open the generated PDF Ultimate Beneficial Owner Report.
4. In the report, visit the **Relationship diagram** section.
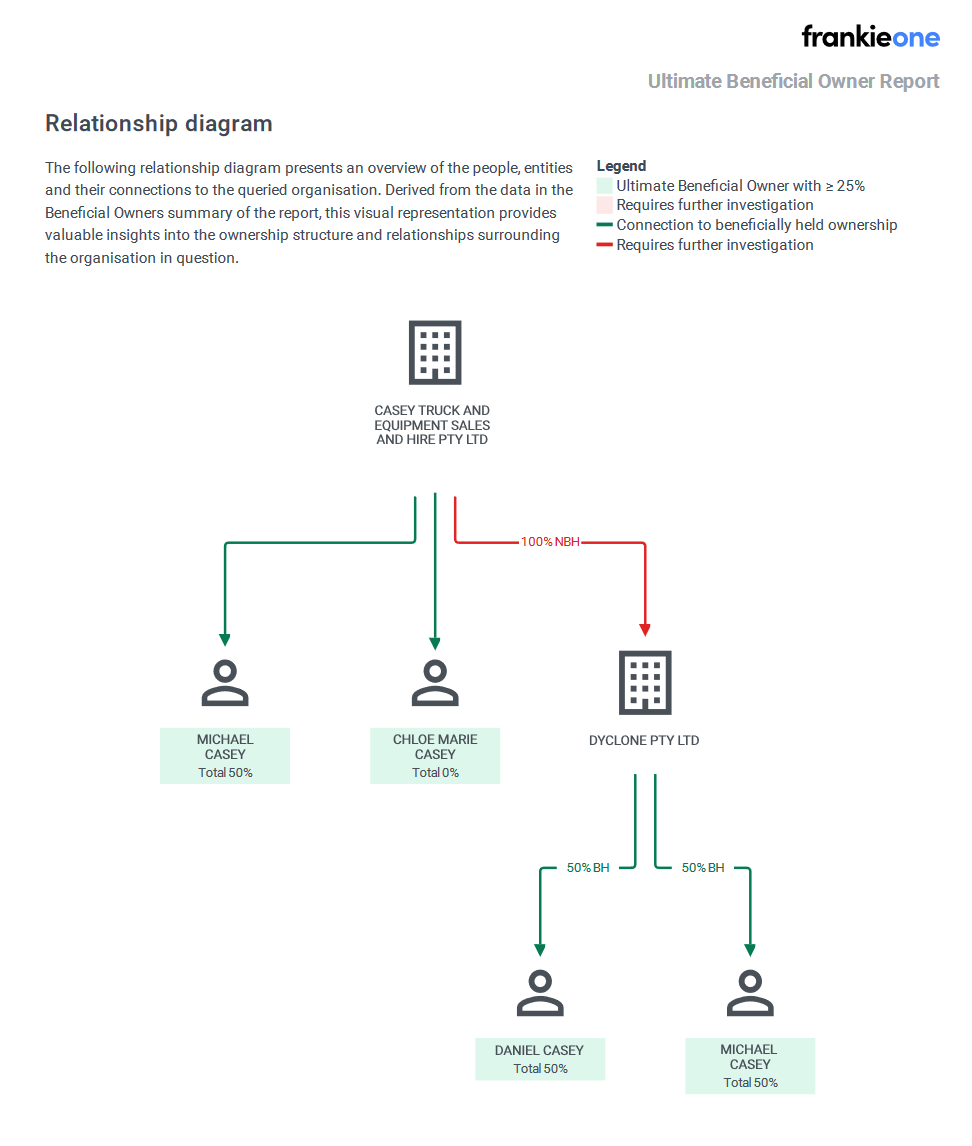 UBO Visual Tree for an organisation including directors of the companies represented.
The relationship diagram adds a **JH** flag or marker on the entity for a Joint Holding.
The relationship diagram also marks the directors and alternate directors using **D** and **AD** markers respectively (only on the top level). A director isn’t always an owner of a business. For these type of directors, they’re depicted with gray connection lines.
## Legend
To better understand the UBO Visual tree, you can refer to the legend found at the bottom of the relationship diagram page.
You can review the legend information below:
| Element | Description |
| ----------------- | ---------------------------------------------- |
| Green background | Ultimate Beneficial Owner with ≥ 25% |
| Red background | Requires further investigation |
| **╼╼** Green line | Connection to beneficially held (BH) ownership |
| **╼╼** Red line | Requires further investigation |
UBO Visual Tree for an organisation including directors of the companies represented.
The relationship diagram adds a **JH** flag or marker on the entity for a Joint Holding.
The relationship diagram also marks the directors and alternate directors using **D** and **AD** markers respectively (only on the top level). A director isn’t always an owner of a business. For these type of directors, they’re depicted with gray connection lines.
## Legend
To better understand the UBO Visual tree, you can refer to the legend found at the bottom of the relationship diagram page.
You can review the legend information below:
| Element | Description |
| ----------------- | ---------------------------------------------- |
| Green background | Ultimate Beneficial Owner with ≥ 25% |
| Red background | Requires further investigation |
| **╼╼** Green line | Connection to beneficially held (BH) ownership |
| **╼╼** Red line | Requires further investigation |