> ## Documentation Index
> Fetch the complete documentation index at: https://docs.frankieone.com/llms.txt
> Use this file to discover all available pages before exploring further.
# Analytics
> The FrankieOne Analytics page allows you to quickly see an overview of your Pass/Fail rates and where issues might be occurring.
The FrankieOne Portal provides embedded analytics to allow you to conveniently access valuable data insights.\
The following section covers essential information for navigating the Analytics tab and examining data at both individual and organisational levels.\
You will learn how to leverage OneSDK, interpret the data dictionary, and apply filters for a customized data view.
## Log into your portal and navigate to the analytics tab
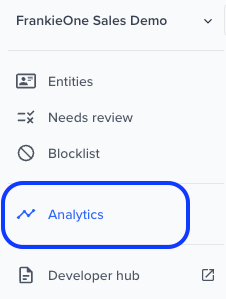
Access your FrankieOne Portal and navigate to the embedded **Analytics** page to view your data.
## Set the view options
You can select the view options at the top of the Analytics page. You can set the following:
* **Final Transaction Timestamp TZ** - this option sets the period or date range to display
* **Recipe** - This option provides a list of all recipe types of the data entries in the selected period or date range. Select the ones you want to display
* **Account** - This option lists the accounts and sub-accounts to which you have access. Select the ones to view.
* **timezone** - This option lists the available time zones to display the data in.
### Save the view
To save the filter settings you used, select the **Save view** link. This will open the **Save view** modal.
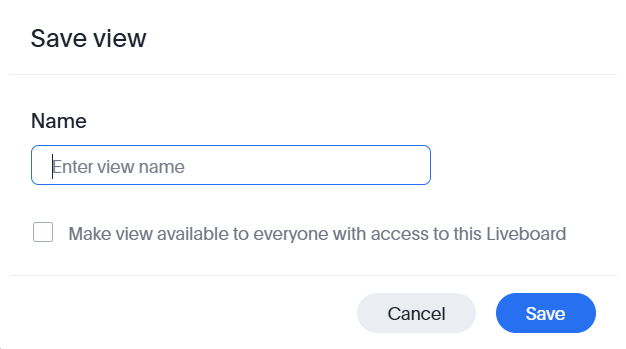
Enter the name you want to use for the saved view. Optionally, you can select to **Make view available to everyone with access to this Liveboard**.
The next time you use the Analytics page, you can select the saved view from the Save view menu.
From the same menu, you can **Manage views** , such as rename or delete saved views, or reset the Liveboard view to the default.
## Review the individual tab
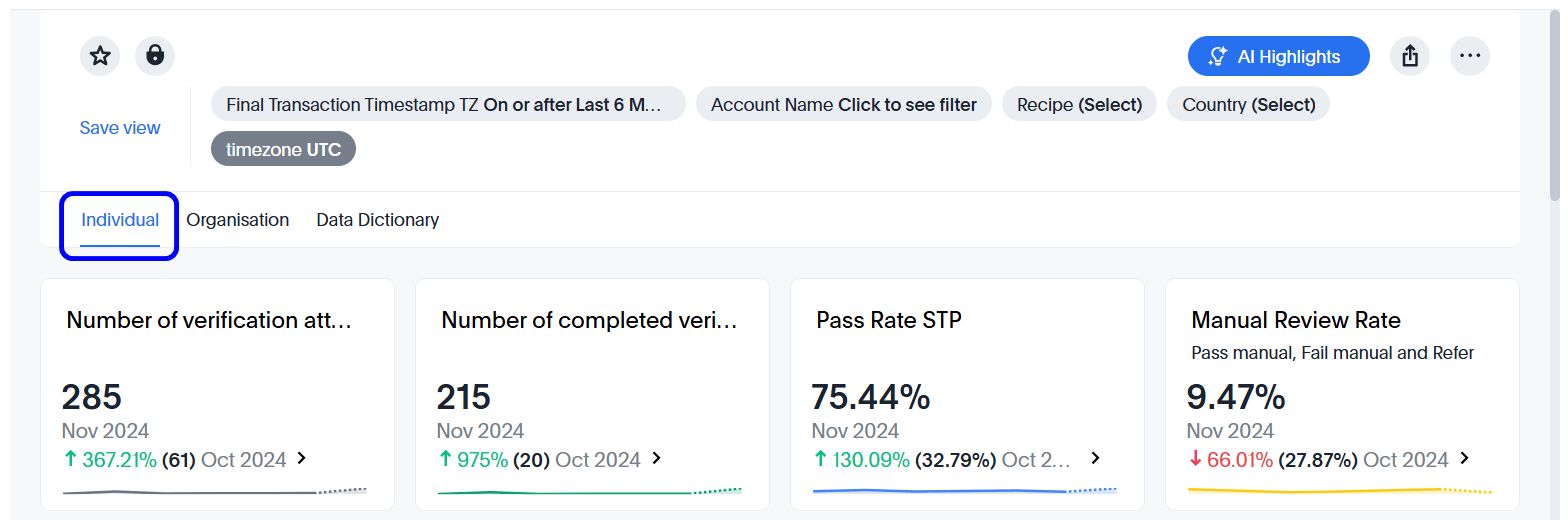 The **Individual** tab contains information on pass rates, and primary fail reasons for your customers. Here, you can find visualisations filtered on **Individuals Only** using the “Latest Entity Data Asset”. The ID Checks Data Asset is also used to run Government ID checks.
Date timestamps are currently in UTC across all Data Sets. The Portal’s Entities tab will display in your local browser time.
## Review the organization tab
Navigate to the **Organisation** tab in the standard dashboard.
If you are a KYB primary customer, you can request a KYB Standard Dashboard via the Jira support system at [help@frankieone.com](mailto:help@frankieone.com).
The **Individual** tab contains information on pass rates, and primary fail reasons for your customers. Here, you can find visualisations filtered on **Individuals Only** using the “Latest Entity Data Asset”. The ID Checks Data Asset is also used to run Government ID checks.
Date timestamps are currently in UTC across all Data Sets. The Portal’s Entities tab will display in your local browser time.
## Review the organization tab
Navigate to the **Organisation** tab in the standard dashboard.
If you are a KYB primary customer, you can request a KYB Standard Dashboard via the Jira support system at [help@frankieone.com](mailto:help@frankieone.com).
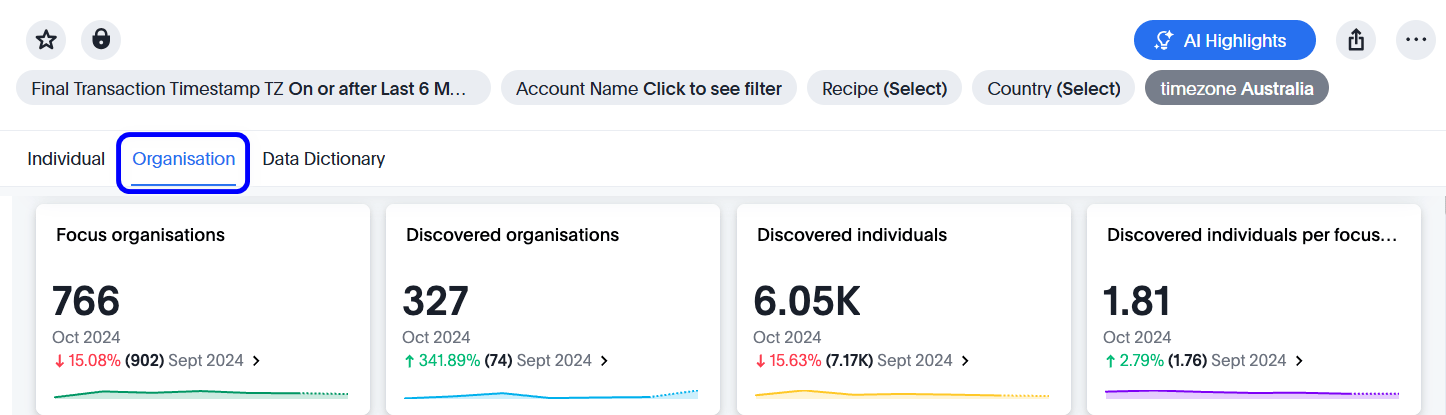 The **Organisation** tab displays information on your focus organisations, discovered organizations, and discovered individuals. Visuals are filtered on these entities using the “Latest Entity Data Asset” and the KYB transactional billing data as a secondary data asset.
## Review the OneSDK tab
If you use our OneSDK, review this tab for information on customer drop-out rates, time to complete, and primary fail reasons.
## Review the data dictionary for definitions
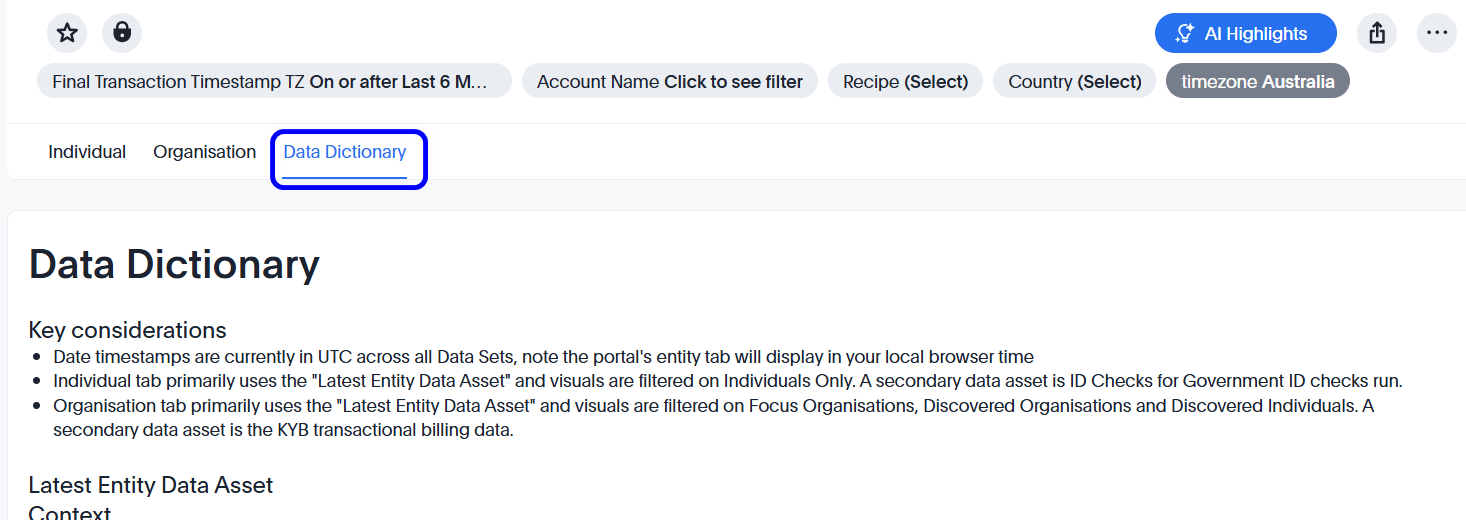
Refer to the data dictionary to understand the definitions of the different metrics and terms used in the embedded analytics.
The **Organisation** tab displays information on your focus organisations, discovered organizations, and discovered individuals. Visuals are filtered on these entities using the “Latest Entity Data Asset” and the KYB transactional billing data as a secondary data asset.
## Review the OneSDK tab
If you use our OneSDK, review this tab for information on customer drop-out rates, time to complete, and primary fail reasons.
## Review the data dictionary for definitions
Refer to the data dictionary to understand the definitions of the different metrics and terms used in the embedded analytics.
 ## Drill down and show underlying data
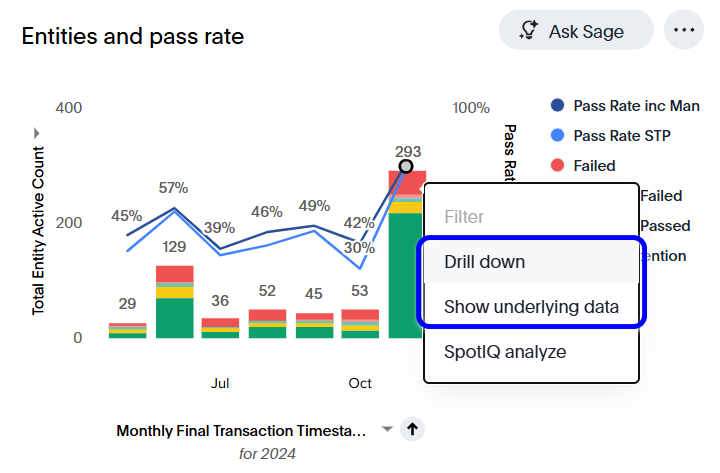
Embedded analytics allows you to drill down and view underlying data. You can use filters to filter across the visuals, providing you with a more customized view of your data.
## Drill down and show underlying data
Embedded analytics allows you to drill down and view underlying data. You can use filters to filter across the visuals, providing you with a more customized view of your data.
 ### Filter data according to your selection
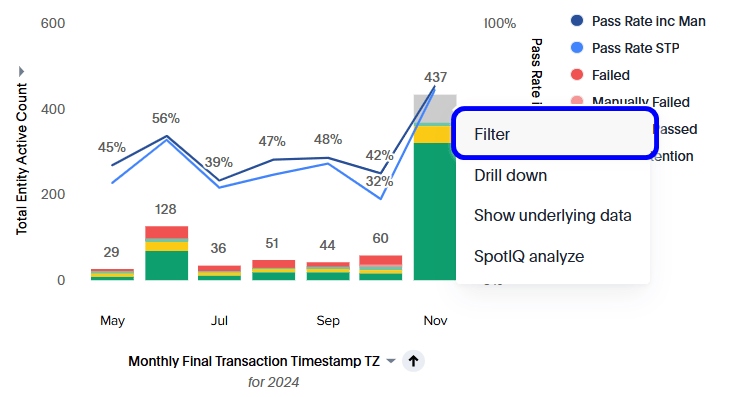
To filter the data presented and only display a specific type of information, select that information type on the graph, open its context menu, and select **Filter**.
### Filter data according to your selection
To filter the data presented and only display a specific type of information, select that information type on the graph, open its context menu, and select **Filter**.
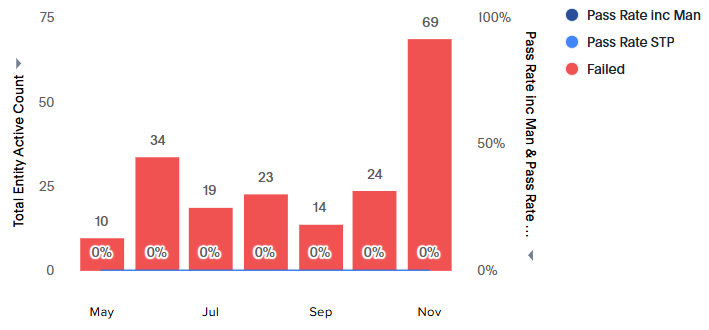
 The graph will be updated and will only display the information filtered.
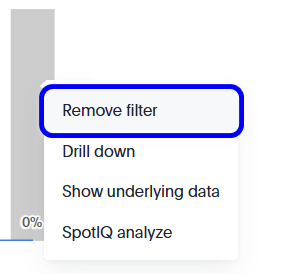
 To remove the filter, select the information presented, open its context menu and select **Remove filter**.
### Drill down on data for further information
You can further investigate the data for a particular status by opening the context menu for the data you want to investigate and selecting **Drill down**.
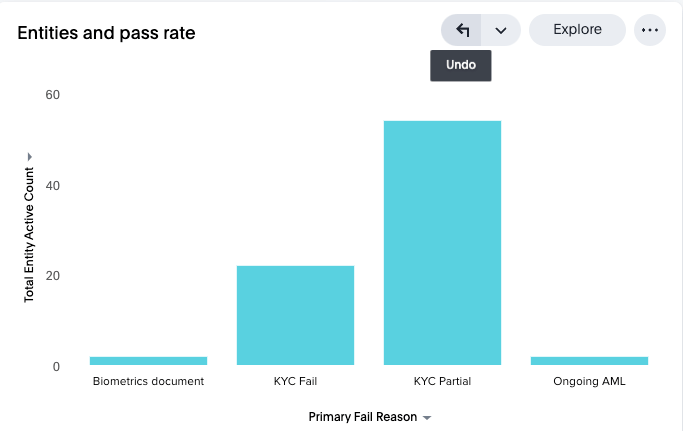
For example, drill down on the **Failed** data and select **Primary Fail Reason**.
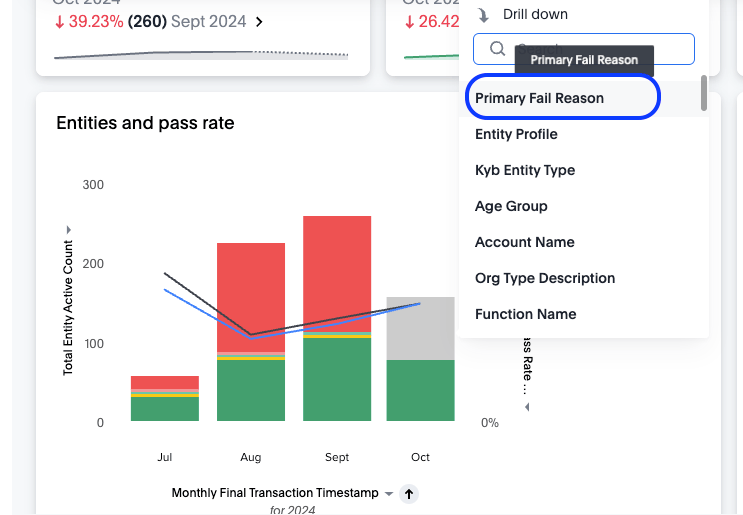 In the example above, the primary fail reason is Partial KYC (a potential partial match in 1 data source; however, it’s not enough for the required KYC ruleset, which may require 2 data sources to be matched) and a full KYC fail (no match at all). Refer to the image below.
 ### Show underlying data
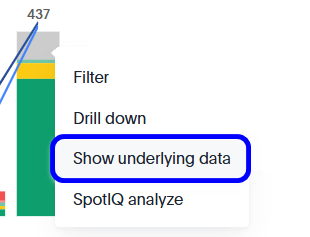
To view the underlying data for the information presented in the graph, open its context menu and select, **Show underlying data**.
### Show underlying data
To view the underlying data for the information presented in the graph, open its context menu and select, **Show underlying data**.
This will open the **Show underlying data** modal where the underlying data is presented in a table.
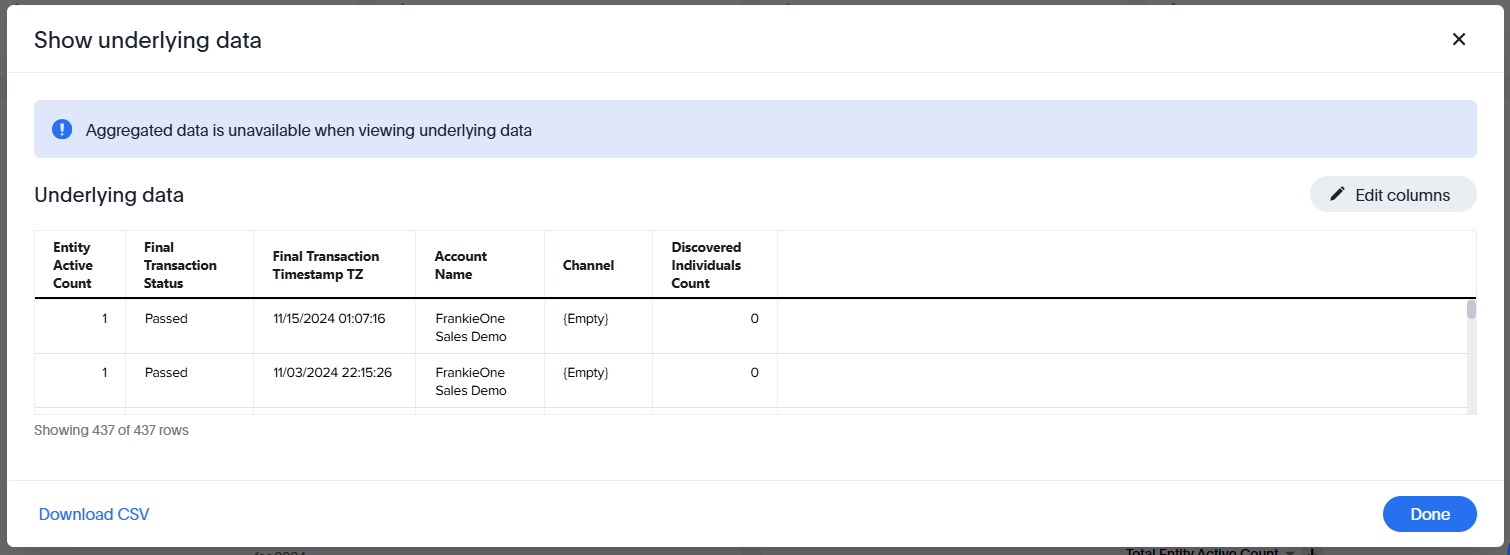
Select **Edit columns** to add or remove the columns displayed.
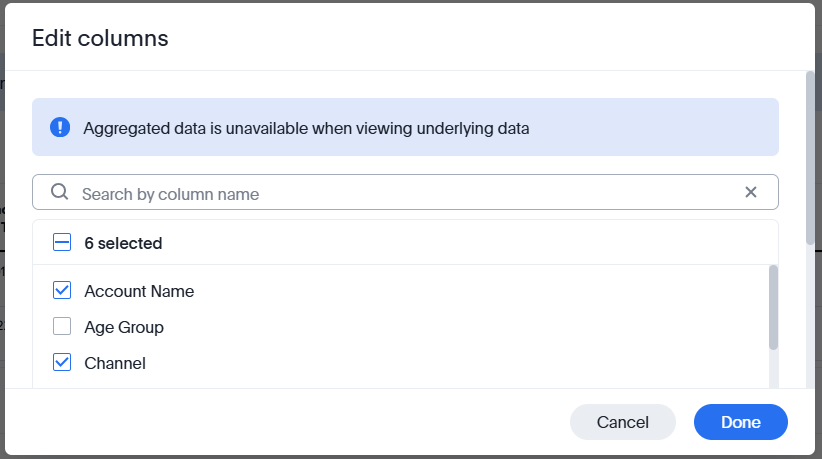
 The **Edit columns** modal opens and lists all the possible columns to display. Select your preferred columns.
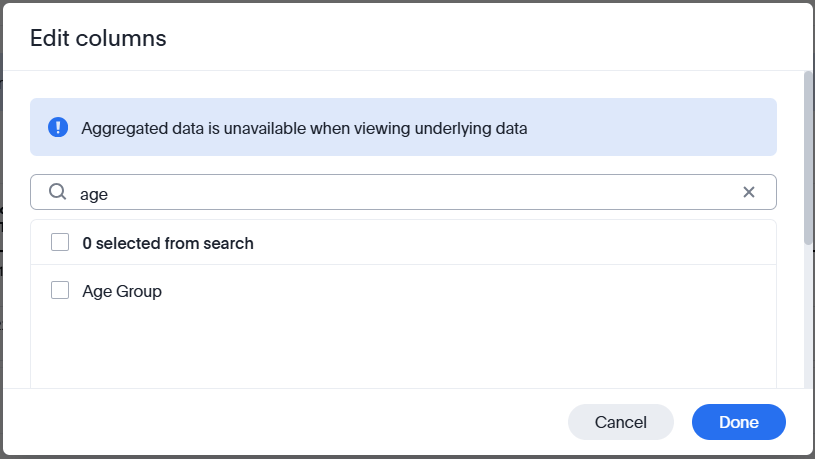
 You can use the search functionality to locate the column you want to be displayed.
 Select the **Download CSV** link to download the data as a **.csv** file.

### Changing the time series on a visual
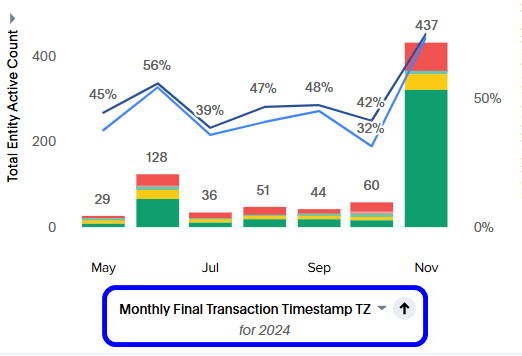
You can further narrow down the information on a particular visual by changing the time series presented.
At the bottom of the graph select the time series selection menu.
This opens the time selection options. Select **Time Bucket** to further display timing options.
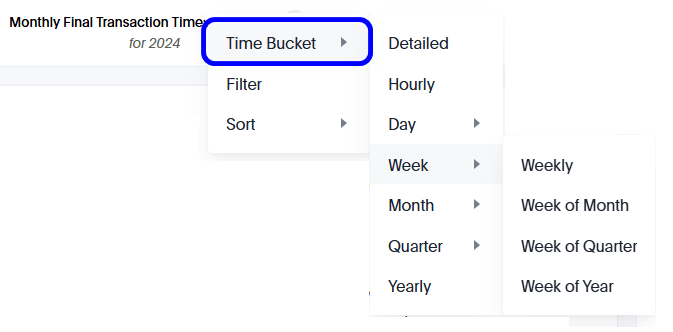 After you make a selection, the visual will be updated to reflect the new time series.
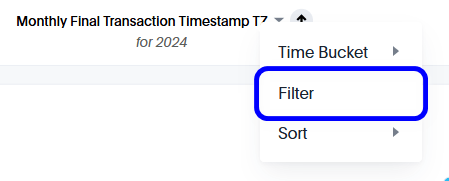
### Filter data by date
To display data for specific dates, select the time series selection menu and select **Filter**.
After you make a selection, the visual will be updated to reflect the new time series.
### Filter data by date
To display data for specific dates, select the time series selection menu and select **Filter**.
This opens the **Select value** modal.
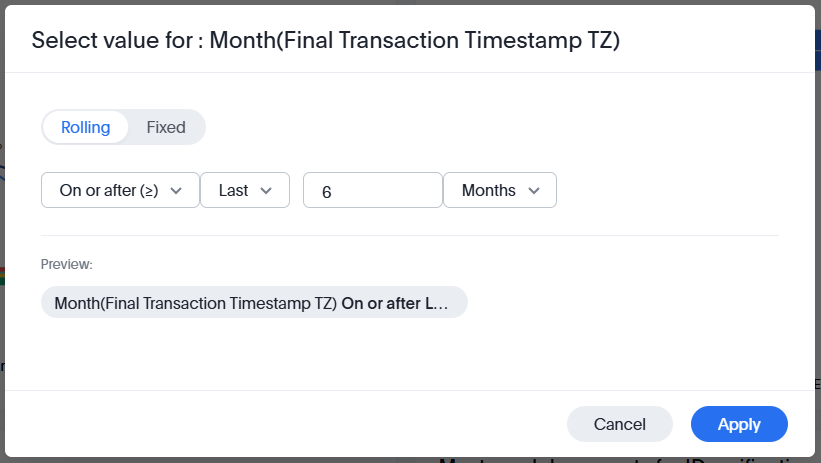 Select whether the time series will be **Rolling** (relative to a period of time) or **Fixed** (based on specific period of time, or dates).
#### Specific date sample
You want to display the data for a specific date, such as 11-Nov-2024. To do so:
1. Open the **Select value** modal.
2. Select **Fixed**.
3. On the dropdown selection menus, select **On (=)**.
4. Select the date from the date selection menu.
5. Click **Apply**.
Refer to the image below.
Select whether the time series will be **Rolling** (relative to a period of time) or **Fixed** (based on specific period of time, or dates).
#### Specific date sample
You want to display the data for a specific date, such as 11-Nov-2024. To do so:
1. Open the **Select value** modal.
2. Select **Fixed**.
3. On the dropdown selection menus, select **On (=)**.
4. Select the date from the date selection menu.
5. Click **Apply**.
Refer to the image below.
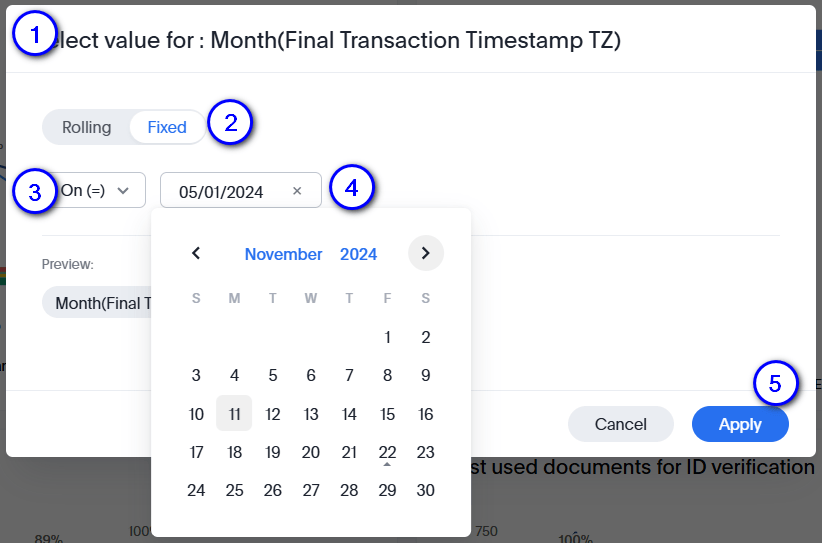 The filter will be applied and the visual will be updated. From this filtered view, you can further drill down or show underlying data.
## Additional features
In addition to the actions mentioned above, you can use additional features to fully exploit the capabilities of the Analytics page.
The filter will be applied and the visual will be updated. From this filtered view, you can further drill down or show underlying data.
## Additional features
In addition to the actions mentioned above, you can use additional features to fully exploit the capabilities of the Analytics page.

### Generate highlights
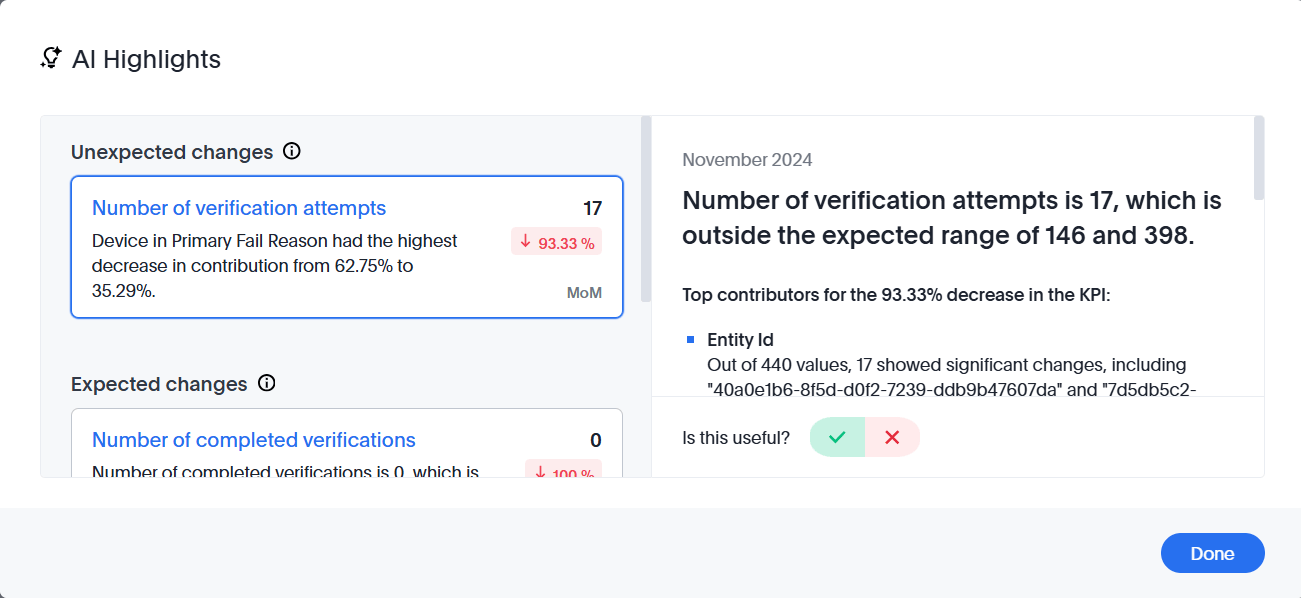
Select the **AI Highlights** to use our advanced AI capabilities to generate highlights from the data presented.
 Once the AI finishes generating the highlights, select **View**. The AI Highlights modal opens with the highlights.
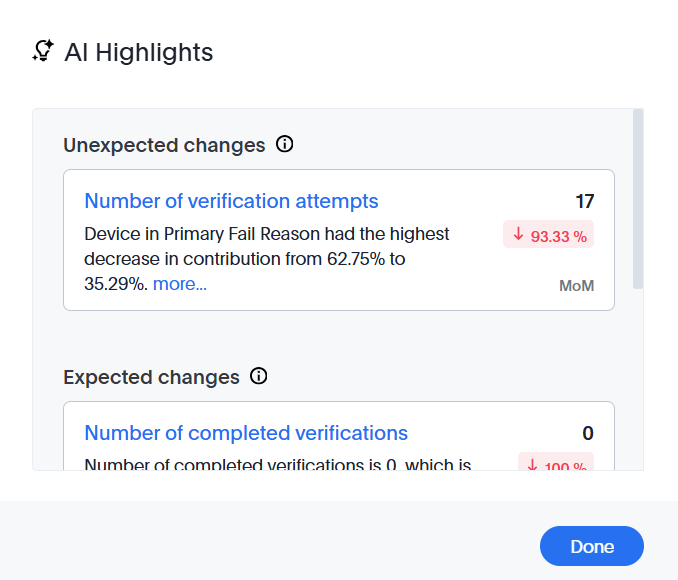 Review the highlights. Select any of the items to see more details.
 ### Share the Liveboard
You can share the Liveboard you are viewing with others. To do so, select the **Share** button. The **Share** modal will open.
##### Note on the Liveboard feature
Liveboard sharing is a premium feature. Email [thoughtspot@frankieone.com](mailto:thoughtspot@frankieone.com) if you’re interested in registering for our premium offering.
### Share the Liveboard
You can share the Liveboard you are viewing with others. To do so, select the **Share** button. The **Share** modal will open.
##### Note on the Liveboard feature
Liveboard sharing is a premium feature. Email [thoughtspot@frankieone.com](mailto:thoughtspot@frankieone.com) if you’re interested in registering for our premium offering.
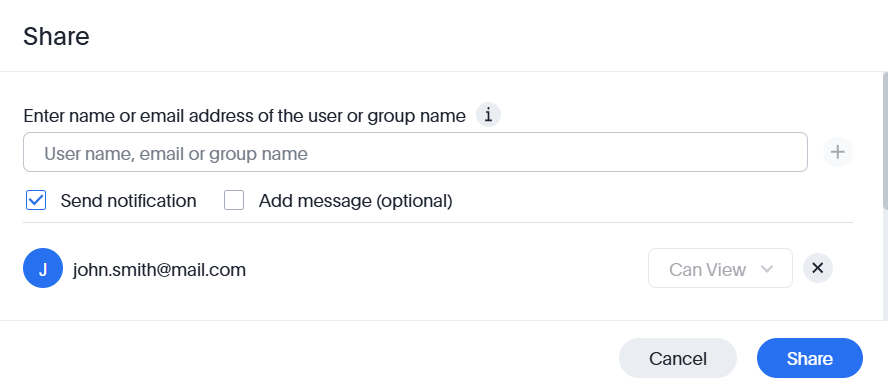 Add the recipients and an optional message for them, and then select **Share**.
Additionally, you can share the link to the Liveboard with those who have access to it. You can copy the link by scrolling down the modal and selecting **copy link**.
Add the recipients and an optional message for them, and then select **Share**.
Additionally, you can share the link to the Liveboard with those who have access to it. You can copy the link by scrolling down the modal and selecting **copy link**.
 ### Use additional actions
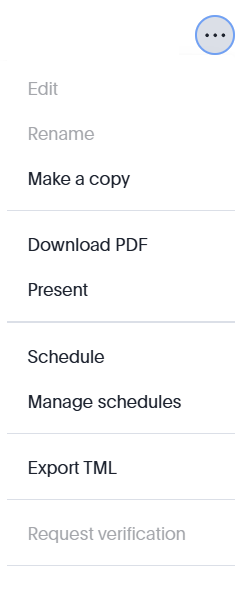
There are additional actions available for you to utilise the capabilities of the Analytics page fully. Select the **Action** menu (represented by three dots), and select the action you want to perform.
### Use additional actions
There are additional actions available for you to utilise the capabilities of the Analytics page fully. Select the **Action** menu (represented by three dots), and select the action you want to perform.
### Add to favorites
If you access several dashboards regularly, you can add the current one to your favourites.
To do so, select the **Add to favorites** button (star icon). To remove the current dashboard from your favourites, select the button again.
## Key considerations
* All data sets’ date timestamps are currently in UTC. The portal’s entity tab will display in your local browser time.
* The **Individual** tab primarily uses the “Latest Entity Data Asset” and visuals are filtered on Individuals Only. A secondary data asset is ID Checks to run Government ID checks.
* The **Organisation** tab primarily uses the “Latest Entity Data Asset” and visuals are filtered on Focus Organisations, Discovered Organisations, and Discovered Individuals. A secondary data asset is the KYB transactional billing data.
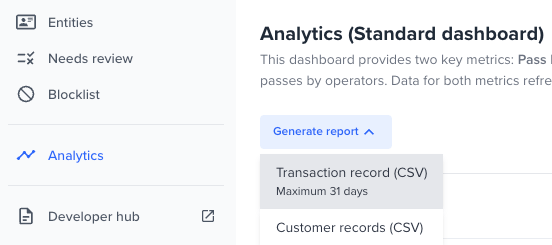
* The **Generate report** capability is still available for both tabs, and the transaction and customer records extracts are available for download.